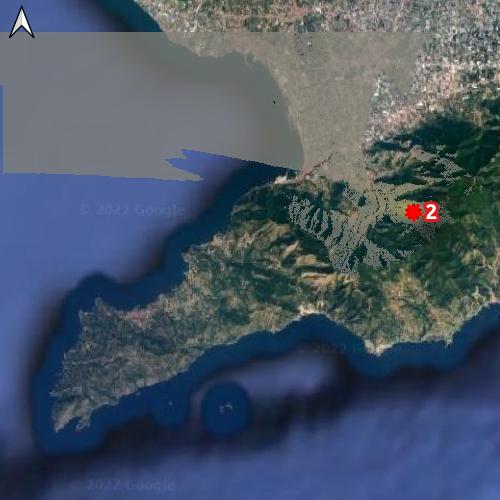
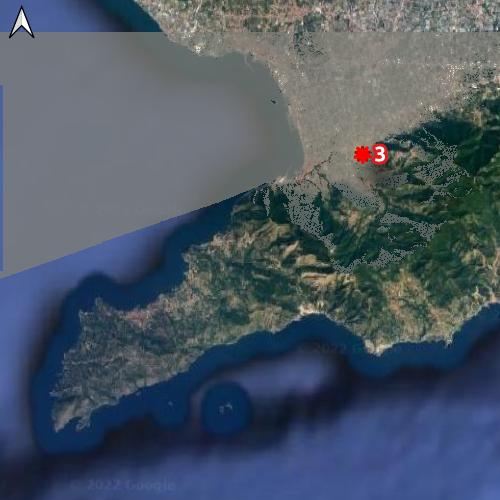
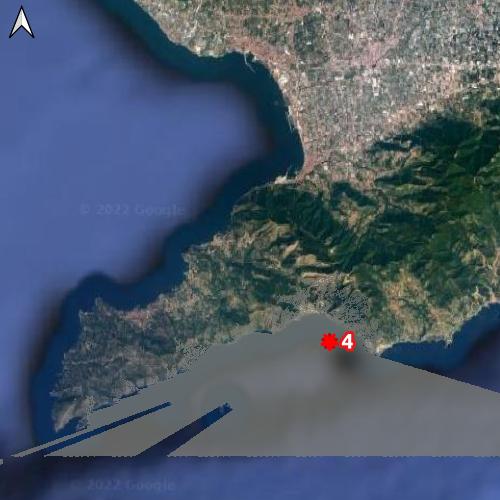
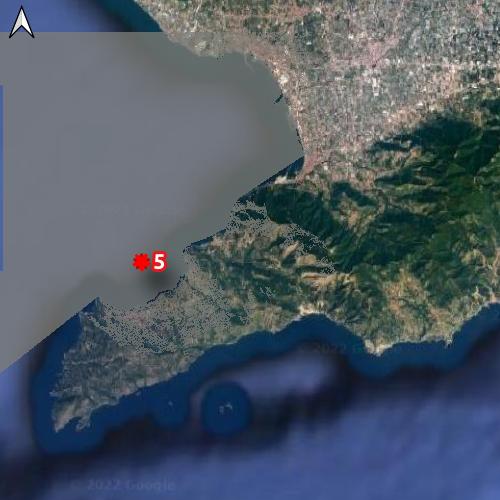
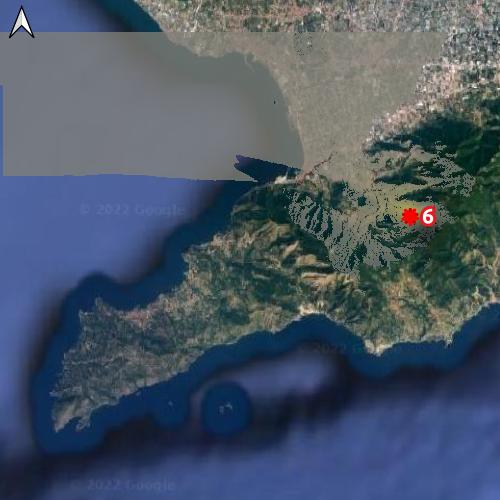
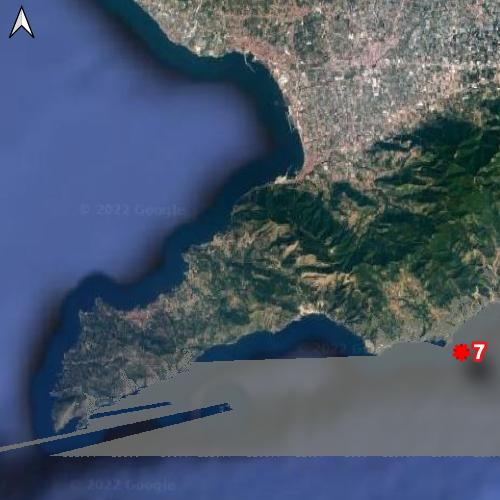
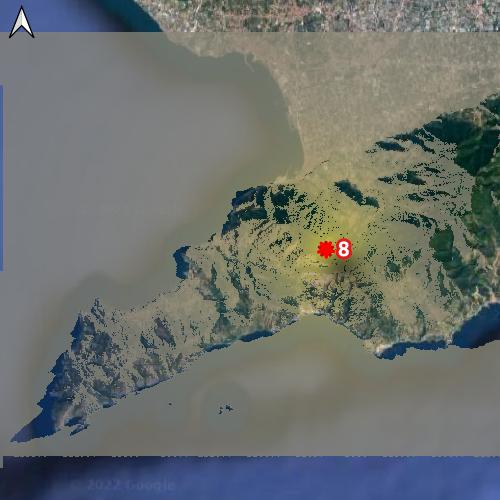
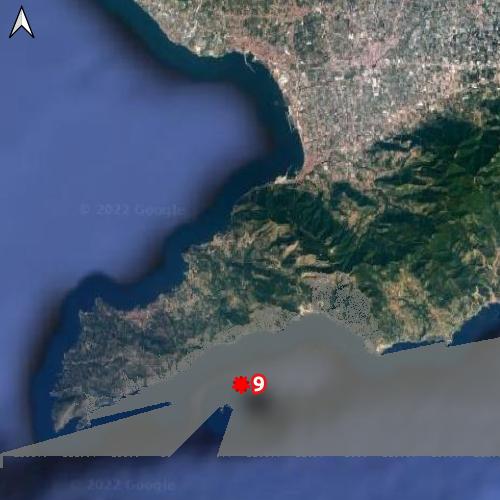
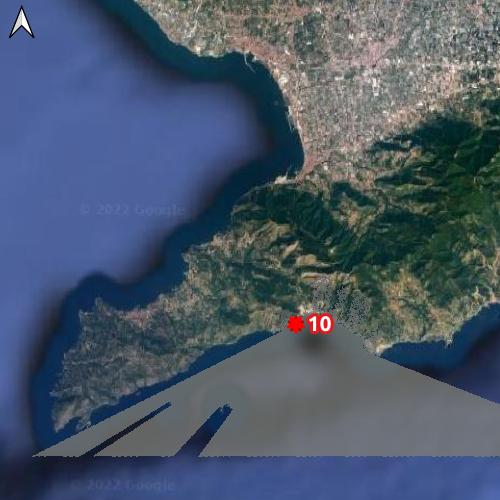
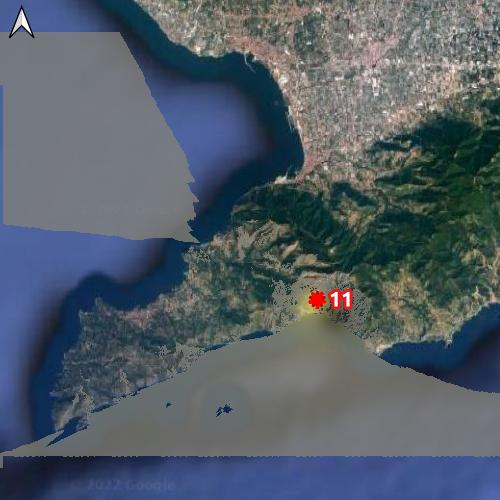
L’analisi di visibilità è un argomento molto interessante da trattare con Python. In un mio articolo l’ho affrontata usando QGIS, qui oggi vediamo come raggiungere lo stesso obiettivo con Python.

Prima di iniziare

Librerie

Per raggiungere l'obiettivo userò le librerie che seguono:

In [1]:
from pathlib import Path
import geopandas as gpd
import rioxarray as rxr
import rasterio as rio
from rasterio.plot import show
import matplotlib.pyplot as plt
from xrspatial import hillshade, viewshed
from xarray.plot import imshow

Fonti dati

Come DEM ho usato un ritaglio del progetto DEM20 di ISPRA su cui ho posizionato con QGIS undici punti; nell'articolo del blog uso l'undicesimo, qui proverò ad usarli tutti.

In [2]:
sample_data = Path.cwd().parent.parent.joinpath('sample_data/viewshed')
dem = sample_data.joinpath('ispra_dtm_20.tif')
points = sample_data.joinpath('poi.shp')

output_folder = Path.cwd().parent.parent.joinpath('output_folder')
Path.mkdir(output_folder, exist_ok=True)

Contenuti

  • 1. Lettura dei dati
  • 2. Analisi su un singolo punto
  • 3. Analisi multipla
  • Conclusione

1. Lettura dei dati

In [3]:
points_data = gpd.read_file(points)
points_data
Out[3]:
fid geometry
0 1 POINT (458757.920 4498413.572)
1 2 POINT (462111.858 4502990.699)
2 3 POINT (459359.399 4506106.798)
3 4 POINT (457577.922 4495996.256)
4 5 POINT (447422.726 4500303.775)
5 6 POINT (461931.392 4502754.454)
6 7 POINT (464694.875 4495428.963)
7 8 POINT (457380.393 4500985.601)
8 9 POINT (452798.980 4493684.317)
9 10 POINT (455753.530 4496944.529)
10 11 POINT (456914.431 4498265.587)
In [4]:
raster = rxr.open_rasterio(dem).squeeze()
raster
Out[4]:
<xarray.DataArray (y: 1176, x: 1464)>
[1721664 values with dtype=int16]
Coordinates:
    band         int64 1
  * x            (x) float64 4.386e+05 4.387e+05 ... 4.679e+05 4.679e+05
  * y            (y) float64 4.513e+06 4.513e+06 ... 4.489e+06 4.489e+06
    spatial_ref  int64 0
Attributes:
    AREA_OR_POINT:  Area
    _FillValue:     -32768
    scale_factor:   1.0
    add_offset:     0.0
xarray.DataArray
  • y: 1176
  • x: 1464
  • ...
    [1721664 values with dtype=int16]
    • band
      ()
      int64
      1
      array(1)
    • x
      (x)
      float64
      4.386e+05 4.387e+05 ... 4.679e+05
      array([438642.315702, 438662.322106, 438682.328509, ..., 467871.671491,
             467891.677894, 467911.684298])
    • y
      (y)
      float64
      4.513e+06 4.513e+06 ... 4.489e+06
      array([4512700.72858, 4512680.72734, 4512660.7261 , ..., 4489239.2739 ,
             4489219.27266, 4489199.27142])
    • spatial_ref
      ()
      int64
      0
      crs_wkt :
      PROJCS["WGS 84 / UTM zone 33N",GEOGCS["WGS 84",DATUM["WGS_1984",SPHEROID["WGS 84",6378137,298.257223563,AUTHORITY["EPSG","7030"]],AUTHORITY["EPSG","6326"]],PRIMEM["Greenwich",0,AUTHORITY["EPSG","8901"]],UNIT["degree",0.0174532925199433,AUTHORITY["EPSG","9122"]],AUTHORITY["EPSG","4326"]],PROJECTION["Transverse_Mercator"],PARAMETER["latitude_of_origin",0],PARAMETER["central_meridian",15],PARAMETER["scale_factor",0.9996],PARAMETER["false_easting",500000],PARAMETER["false_northing",0],UNIT["metre",1,AUTHORITY["EPSG","9001"]],AXIS["Easting",EAST],AXIS["Northing",NORTH],AUTHORITY["EPSG","32633"]]
      semi_major_axis :
      6378137.0
      semi_minor_axis :
      6356752.314245179
      inverse_flattening :
      298.257223563
      reference_ellipsoid_name :
      WGS 84
      longitude_of_prime_meridian :
      0.0
      prime_meridian_name :
      Greenwich
      geographic_crs_name :
      WGS 84
      horizontal_datum_name :
      World Geodetic System 1984
      projected_crs_name :
      WGS 84 / UTM zone 33N
      grid_mapping_name :
      transverse_mercator
      latitude_of_projection_origin :
      0.0
      longitude_of_central_meridian :
      15.0
      false_easting :
      500000.0
      false_northing :
      0.0
      scale_factor_at_central_meridian :
      0.9996
      spatial_ref :
      PROJCS["WGS 84 / UTM zone 33N",GEOGCS["WGS 84",DATUM["WGS_1984",SPHEROID["WGS 84",6378137,298.257223563,AUTHORITY["EPSG","7030"]],AUTHORITY["EPSG","6326"]],PRIMEM["Greenwich",0,AUTHORITY["EPSG","8901"]],UNIT["degree",0.0174532925199433,AUTHORITY["EPSG","9122"]],AUTHORITY["EPSG","4326"]],PROJECTION["Transverse_Mercator"],PARAMETER["latitude_of_origin",0],PARAMETER["central_meridian",15],PARAMETER["scale_factor",0.9996],PARAMETER["false_easting",500000],PARAMETER["false_northing",0],UNIT["metre",1,AUTHORITY["EPSG","9001"]],AXIS["Easting",EAST],AXIS["Northing",NORTH],AUTHORITY["EPSG","32633"]]
      GeoTransform :
      438632.3125 20.00640368852459 0.0 4512710.7292 0.0 -20.001240136054324
      array(0)
    • x
      PandasIndex
      PandasIndex(Index([ 438642.3157018443,  438662.3221055328,  438682.3285092213,
             438702.33491290984,  438722.3413165984,  438742.3477202869,
             438762.35412397544, 438782.36052766396,  438802.3669313525,
               438822.373335041,
             ...
               467731.626664959,  467751.6330686476,  467771.6394723361,
              467791.6458760246, 467811.65227971313, 467831.65868340165,
             467851.66508709016,  467871.6714907787, 467891.67789446726,
              467911.6842981558],
            dtype='float64', name='x', length=1464))
    • y
      PandasIndex
      PandasIndex(Index([ 4512700.728579932,  4512680.727339796,   4512660.72609966,
              4512640.724859524, 4512620.7236193875,  4512600.722379251,
              4512580.721139115,  4512560.719898979,  4512540.718658843,
              4512520.717418707,
             ...
              4489379.282581292,  4489359.281341157,  4489339.280101021,
              4489319.278860885,  4489299.277620749, 4489279.2763806125,
              4489259.275140476,   4489239.27390034,  4489219.272660204,
              4489199.271420068],
            dtype='float64', name='y', length=1176))
  • AREA_OR_POINT :
    Area
    _FillValue :
    -32768
    scale_factor :
    1.0
    add_offset :
    0.0

Il vettore dei punti è molto semplice, ha una colonna con le geometrie ed una che identifica il singolo punto; quest'ultima informazione la userò più avanti. Il DEM è rettangolare e monobanda ed in effetti mi aspetto che sia monobanda poichè è quella che contiene le informazioni altimetriche in questo caso, con squeeze() estraggo la banda.

Il DEM ha come valore minimo di quota 0 metri, ma quale è la quota massima?

In [5]:
max_h = int(raster.max().data)
print(f'La quota massima è {max_h} metri')
La quota massima è 1429 metri

1.1 Visualizzazione dei dati grezzi

In [6]:
raster_data = rio.open(dem)

fig, ax = plt.subplots(figsize=(10, 10))
show(
    source=raster_data,
    cmap='tab20c_r',
    contour=True,
    ax=ax,
    transform=raster_data.transform
)
show(
    source=raster_data,
    cmap='terrain_r',
    ax=ax,
    transform=raster_data.transform
)
for _index, row in points_data.iterrows():
    coordinates = row.geometry.xy
    ax.scatter(
        *coordinates,
        s=1000,
        marker="*",
        facecolor='red',
        edgecolor='black'
    )
    plt.text(
        x=coordinates[0][0],
        y=coordinates[1][0],
        s=row.fid,
        fontdict=dict(color='black', size=10),
        bbox=dict(facecolor='white', alpha=0.75)
    )
plt.show()
No description has been provided for this image

2. Analisi su un singolo punto

In [7]:
single_point = points_data[points_data['fid'] == 11]
single_point
Out[7]:
fid geometry
10 11 POINT (456914.431 4498265.587)

Ho selezionato solo il punto con id 11, è quello che ho usato nell'articolo del mio blog. Prima di partire con l'analisi è bene sapere che il risultato di una analisi di visibilità, detta anche viewshed, è un raster con valori che vanno da 0 a 180. Questi sono gradi e fanno riferimento alla visuale verticale dal punto di osservazione. Un valore pari a 0° sta ad indicare che quel pixel è proprio sotto il punto di osservazione, un valore pari a 90° sta a significare che il pixel è sull'orizzonte del punto di osservazione ed un valore pari a 180°, di conseguenza, indica che il pixel è proprio sopra il punto di osservazione.

In [8]:
make_hillshade = hillshade(raster)

fig, ax = plt.subplots(figsize=(20, 10))
imshow(
    make_hillshade,
    ax=ax,
    cmap='gist_gray',
)
imshow(
    raster,
    ax=ax,
    cmap='terrain',
    vmin=1,
    vmax=max_h,
    levels=100,
    alpha=0.75
)
for _index, row in single_point.iterrows():
    coordinates = row.geometry.xy
    ax.scatter(
        *coordinates,
        s=1000,
        marker="*",
        facecolor='red',
        edgecolor='black'
    )
    plt.text(
        x=coordinates[0][0],
        y=coordinates[1][0],
        s=row.fid,
        fontdict=dict(color='black', size=10),
        bbox=dict(facecolor='white', alpha=0.75)
    )

plt.show()
No description has been provided for this image

Per una migliore resa visiva ho inserito la hillshade sotto al DEM tematizzato. Questa volta anzicchè usare la funzione show di rasterio ho preferito usare imshow di xarray per sperimentarla un po' visto che non l'avevo mai usata. E' interessante il fatto che aggiunga automaticamente la colorbar per ogni raster, devo capire come fare in modo che non venga visualizzata sempre e come disporla in altro modo.

2.1 Quota dell'osservatore

La quota dell'osservatore è un dato fondamentale per portare a termine una analisi di visibilità. Può essere la quota del punto in cui si trova l'osservatore o una quota fittizia compatibile con la topografia dell'area(l'osservatore fittizio non può essere a 100 metri di altezza se stiamo esaminando un'area in cui la quota minima è 500 metri). Quello che manca nei miei dati è proprio la quota!

Ma non è un problema perchè mi viene in soccorso un'esperianza già fatta di recente e che vado a riprodurre:

In [9]:
x_coord = single_point.iloc[0].geometry.xy[0][0]
y_coord = single_point.iloc[0].geometry.xy[1][0]

dataarray_value = raster.sel(x=x_coord, y=y_coord, method="nearest")
pixel_value = dataarray_value.data

pixel_value
Out[9]:
array(450, dtype=int16)

Ora che ho tutto quello che mi serve posso effettuare l'analisi di visibilità.

In [10]:
view = viewshed(raster, x=x_coord, y=y_coord, observer_elev=pixel_value)
view
Out[10]:
<xarray.DataArray (y: 1176, x: 1464)>
array([[87.78651279, 87.78502168, 87.78352919, ..., -1.        ,
        -1.        , -1.        ],
       [87.78533465, 87.78384115, 87.78234627, ..., -1.        ,
        -1.        , -1.        ],
       [87.78415626, 87.78266038, 87.7811631 , ..., -1.        ,
        -1.        , -1.        ],
       ...,
       [87.47039509, 87.46816885, 87.46593917, ..., -1.        ,
        -1.        , -1.        ],
       [87.47149388, 87.46927054, 87.46704378, ..., -1.        ,
        -1.        , -1.        ],
       [87.47259367, 87.47037324, 87.46814939, ..., -1.        ,
        -1.        , -1.        ]])
Coordinates:
    band         int64 1
  * x            (x) float64 4.386e+05 4.387e+05 ... 4.679e+05 4.679e+05
  * y            (y) float64 4.513e+06 4.513e+06 ... 4.489e+06 4.489e+06
    spatial_ref  int64 0
Attributes:
    AREA_OR_POINT:  Area
    _FillValue:     -32768
    scale_factor:   1.0
    add_offset:     0.0
xarray.DataArray
  • y: 1176
  • x: 1464
  • 87.79 87.79 87.78 87.78 87.78 87.78 ... -1.0 -1.0 -1.0 -1.0 -1.0 -1.0
    array([[87.78651279, 87.78502168, 87.78352919, ..., -1.        ,
            -1.        , -1.        ],
           [87.78533465, 87.78384115, 87.78234627, ..., -1.        ,
            -1.        , -1.        ],
           [87.78415626, 87.78266038, 87.7811631 , ..., -1.        ,
            -1.        , -1.        ],
           ...,
           [87.47039509, 87.46816885, 87.46593917, ..., -1.        ,
            -1.        , -1.        ],
           [87.47149388, 87.46927054, 87.46704378, ..., -1.        ,
            -1.        , -1.        ],
           [87.47259367, 87.47037324, 87.46814939, ..., -1.        ,
            -1.        , -1.        ]])
    • band
      ()
      int64
      1
      array(1)
    • x
      (x)
      float64
      4.386e+05 4.387e+05 ... 4.679e+05
      array([438642.315702, 438662.322106, 438682.328509, ..., 467871.671491,
             467891.677894, 467911.684298])
    • y
      (y)
      float64
      4.513e+06 4.513e+06 ... 4.489e+06
      array([4512700.72858, 4512680.72734, 4512660.7261 , ..., 4489239.2739 ,
             4489219.27266, 4489199.27142])
    • spatial_ref
      ()
      int64
      0
      crs_wkt :
      PROJCS["WGS 84 / UTM zone 33N",GEOGCS["WGS 84",DATUM["WGS_1984",SPHEROID["WGS 84",6378137,298.257223563,AUTHORITY["EPSG","7030"]],AUTHORITY["EPSG","6326"]],PRIMEM["Greenwich",0,AUTHORITY["EPSG","8901"]],UNIT["degree",0.0174532925199433,AUTHORITY["EPSG","9122"]],AUTHORITY["EPSG","4326"]],PROJECTION["Transverse_Mercator"],PARAMETER["latitude_of_origin",0],PARAMETER["central_meridian",15],PARAMETER["scale_factor",0.9996],PARAMETER["false_easting",500000],PARAMETER["false_northing",0],UNIT["metre",1,AUTHORITY["EPSG","9001"]],AXIS["Easting",EAST],AXIS["Northing",NORTH],AUTHORITY["EPSG","32633"]]
      semi_major_axis :
      6378137.0
      semi_minor_axis :
      6356752.314245179
      inverse_flattening :
      298.257223563
      reference_ellipsoid_name :
      WGS 84
      longitude_of_prime_meridian :
      0.0
      prime_meridian_name :
      Greenwich
      geographic_crs_name :
      WGS 84
      horizontal_datum_name :
      World Geodetic System 1984
      projected_crs_name :
      WGS 84 / UTM zone 33N
      grid_mapping_name :
      transverse_mercator
      latitude_of_projection_origin :
      0.0
      longitude_of_central_meridian :
      15.0
      false_easting :
      500000.0
      false_northing :
      0.0
      scale_factor_at_central_meridian :
      0.9996
      spatial_ref :
      PROJCS["WGS 84 / UTM zone 33N",GEOGCS["WGS 84",DATUM["WGS_1984",SPHEROID["WGS 84",6378137,298.257223563,AUTHORITY["EPSG","7030"]],AUTHORITY["EPSG","6326"]],PRIMEM["Greenwich",0,AUTHORITY["EPSG","8901"]],UNIT["degree",0.0174532925199433,AUTHORITY["EPSG","9122"]],AUTHORITY["EPSG","4326"]],PROJECTION["Transverse_Mercator"],PARAMETER["latitude_of_origin",0],PARAMETER["central_meridian",15],PARAMETER["scale_factor",0.9996],PARAMETER["false_easting",500000],PARAMETER["false_northing",0],UNIT["metre",1,AUTHORITY["EPSG","9001"]],AXIS["Easting",EAST],AXIS["Northing",NORTH],AUTHORITY["EPSG","32633"]]
      GeoTransform :
      438632.3125 20.00640368852459 0.0 4512710.7292 0.0 -20.001240136054324
      array(0)
    • x
      PandasIndex
      PandasIndex(Index([ 438642.3157018443,  438662.3221055328,  438682.3285092213,
             438702.33491290984,  438722.3413165984,  438742.3477202869,
             438762.35412397544, 438782.36052766396,  438802.3669313525,
               438822.373335041,
             ...
               467731.626664959,  467751.6330686476,  467771.6394723361,
              467791.6458760246, 467811.65227971313, 467831.65868340165,
             467851.66508709016,  467871.6714907787, 467891.67789446726,
              467911.6842981558],
            dtype='float64', name='x', length=1464))
    • y
      PandasIndex
      PandasIndex(Index([ 4512700.728579932,  4512680.727339796,   4512660.72609966,
              4512640.724859524, 4512620.7236193875,  4512600.722379251,
              4512580.721139115,  4512560.719898979,  4512540.718658843,
              4512520.717418707,
             ...
              4489379.282581292,  4489359.281341157,  4489339.280101021,
              4489319.278860885,  4489299.277620749, 4489279.2763806125,
              4489259.275140476,   4489239.27390034,  4489219.272660204,
              4489199.271420068],
            dtype='float64', name='y', length=1176))
  • AREA_OR_POINT :
    Area
    _FillValue :
    -32768
    scale_factor :
    1.0
    add_offset :
    0.0
In [11]:
view_sel = view.where(view >= 0)
view_sel
Out[11]:
<xarray.DataArray (y: 1176, x: 1464)>
array([[87.78651279, 87.78502168, 87.78352919, ...,         nan,
                nan,         nan],
       [87.78533465, 87.78384115, 87.78234627, ...,         nan,
                nan,         nan],
       [87.78415626, 87.78266038, 87.7811631 , ...,         nan,
                nan,         nan],
       ...,
       [87.47039509, 87.46816885, 87.46593917, ...,         nan,
                nan,         nan],
       [87.47149388, 87.46927054, 87.46704378, ...,         nan,
                nan,         nan],
       [87.47259367, 87.47037324, 87.46814939, ...,         nan,
                nan,         nan]])
Coordinates:
    band         int64 1
  * x            (x) float64 4.386e+05 4.387e+05 ... 4.679e+05 4.679e+05
  * y            (y) float64 4.513e+06 4.513e+06 ... 4.489e+06 4.489e+06
    spatial_ref  int64 0
Attributes:
    AREA_OR_POINT:  Area
    _FillValue:     -32768
    scale_factor:   1.0
    add_offset:     0.0
xarray.DataArray
  • y: 1176
  • x: 1464
  • 87.79 87.79 87.78 87.78 87.78 87.78 87.78 ... nan nan nan nan nan nan
    array([[87.78651279, 87.78502168, 87.78352919, ...,         nan,
                    nan,         nan],
           [87.78533465, 87.78384115, 87.78234627, ...,         nan,
                    nan,         nan],
           [87.78415626, 87.78266038, 87.7811631 , ...,         nan,
                    nan,         nan],
           ...,
           [87.47039509, 87.46816885, 87.46593917, ...,         nan,
                    nan,         nan],
           [87.47149388, 87.46927054, 87.46704378, ...,         nan,
                    nan,         nan],
           [87.47259367, 87.47037324, 87.46814939, ...,         nan,
                    nan,         nan]])
    • band
      ()
      int64
      1
      array(1)
    • x
      (x)
      float64
      4.386e+05 4.387e+05 ... 4.679e+05
      array([438642.315702, 438662.322106, 438682.328509, ..., 467871.671491,
             467891.677894, 467911.684298])
    • y
      (y)
      float64
      4.513e+06 4.513e+06 ... 4.489e+06
      array([4512700.72858, 4512680.72734, 4512660.7261 , ..., 4489239.2739 ,
             4489219.27266, 4489199.27142])
    • spatial_ref
      ()
      int64
      0
      crs_wkt :
      PROJCS["WGS 84 / UTM zone 33N",GEOGCS["WGS 84",DATUM["WGS_1984",SPHEROID["WGS 84",6378137,298.257223563,AUTHORITY["EPSG","7030"]],AUTHORITY["EPSG","6326"]],PRIMEM["Greenwich",0,AUTHORITY["EPSG","8901"]],UNIT["degree",0.0174532925199433,AUTHORITY["EPSG","9122"]],AUTHORITY["EPSG","4326"]],PROJECTION["Transverse_Mercator"],PARAMETER["latitude_of_origin",0],PARAMETER["central_meridian",15],PARAMETER["scale_factor",0.9996],PARAMETER["false_easting",500000],PARAMETER["false_northing",0],UNIT["metre",1,AUTHORITY["EPSG","9001"]],AXIS["Easting",EAST],AXIS["Northing",NORTH],AUTHORITY["EPSG","32633"]]
      semi_major_axis :
      6378137.0
      semi_minor_axis :
      6356752.314245179
      inverse_flattening :
      298.257223563
      reference_ellipsoid_name :
      WGS 84
      longitude_of_prime_meridian :
      0.0
      prime_meridian_name :
      Greenwich
      geographic_crs_name :
      WGS 84
      horizontal_datum_name :
      World Geodetic System 1984
      projected_crs_name :
      WGS 84 / UTM zone 33N
      grid_mapping_name :
      transverse_mercator
      latitude_of_projection_origin :
      0.0
      longitude_of_central_meridian :
      15.0
      false_easting :
      500000.0
      false_northing :
      0.0
      scale_factor_at_central_meridian :
      0.9996
      spatial_ref :
      PROJCS["WGS 84 / UTM zone 33N",GEOGCS["WGS 84",DATUM["WGS_1984",SPHEROID["WGS 84",6378137,298.257223563,AUTHORITY["EPSG","7030"]],AUTHORITY["EPSG","6326"]],PRIMEM["Greenwich",0,AUTHORITY["EPSG","8901"]],UNIT["degree",0.0174532925199433,AUTHORITY["EPSG","9122"]],AUTHORITY["EPSG","4326"]],PROJECTION["Transverse_Mercator"],PARAMETER["latitude_of_origin",0],PARAMETER["central_meridian",15],PARAMETER["scale_factor",0.9996],PARAMETER["false_easting",500000],PARAMETER["false_northing",0],UNIT["metre",1,AUTHORITY["EPSG","9001"]],AXIS["Easting",EAST],AXIS["Northing",NORTH],AUTHORITY["EPSG","32633"]]
      GeoTransform :
      438632.3125 20.00640368852459 0.0 4512710.7292 0.0 -20.001240136054324
      array(0)
    • x
      PandasIndex
      PandasIndex(Index([ 438642.3157018443,  438662.3221055328,  438682.3285092213,
             438702.33491290984,  438722.3413165984,  438742.3477202869,
             438762.35412397544, 438782.36052766396,  438802.3669313525,
               438822.373335041,
             ...
               467731.626664959,  467751.6330686476,  467771.6394723361,
              467791.6458760246, 467811.65227971313, 467831.65868340165,
             467851.66508709016,  467871.6714907787, 467891.67789446726,
              467911.6842981558],
            dtype='float64', name='x', length=1464))
    • y
      PandasIndex
      PandasIndex(Index([ 4512700.728579932,  4512680.727339796,   4512660.72609966,
              4512640.724859524, 4512620.7236193875,  4512600.722379251,
              4512580.721139115,  4512560.719898979,  4512540.718658843,
              4512520.717418707,
             ...
              4489379.282581292,  4489359.281341157,  4489339.280101021,
              4489319.278860885,  4489299.277620749, 4489279.2763806125,
              4489259.275140476,   4489239.27390034,  4489219.272660204,
              4489199.271420068],
            dtype='float64', name='y', length=1176))
  • AREA_OR_POINT :
    Area
    _FillValue :
    -32768
    scale_factor :
    1.0
    add_offset :
    0.0
In [12]:
fig, ax = plt.subplots(figsize=(20, 10))
imshow(view_sel, ax=ax)
plt.show()
No description has been provided for this image

Analisi effettuata, ora sono curioso di vedere quali aree ricadono nel campo visivo dell'osservatore.

In [13]:
fig, ax = plt.subplots(figsize=(20, 10))
imshow(
    make_hillshade,
    ax=ax,
    cmap='gist_gray',
)
imshow(
    raster,
    ax=ax,
    cmap='terrain',
    vmin=1,
    vmax=max_h,
    levels=100,
    alpha=0.75
)
imshow(view_sel, ax=ax, cmap='Wistia')


ax.scatter(
    *single_point.iloc[0].geometry.xy,
    s=1000,
    marker="*",
    facecolor='red',
    edgecolor='black'
)
plt.text(
    x=coordinates[0][0],
    y=coordinates[1][0],
    s=row.fid,
    fontdict=dict(color='black', size=10),
    bbox=dict(facecolor='white', alpha=0.75)
)

plt.show()
No description has been provided for this image

Le aree in tonalità di giallo sono quelle che vede l'osservatore, in questo caso vede benissimo Positano, gli isolotti del Gallo e di Vetara ma anche parte del Golfo di Napoli, forse anche il Vesuvio.

3. Analisi multipla

E' arrivato il momento di usare tutti i punti!

In [14]:
for _index, row in points_data.iterrows():
    point_geometry = row.geometry.xy
    x_coord = point_geometry[0][0]
    y_coord = point_geometry[1][0]

    dataarray_value = raster.sel(x=x_coord, y=y_coord, method="nearest")
    pixel_value = dataarray_value.data

    view = viewshed(raster, x=x_coord, y=y_coord, observer_elev=pixel_value)

    view_sel = view.where(view >= 0)
    # Salvataggio dei risultati
    output_file = output_folder.joinpath(f'viewshed_point{row.fid}_h{pixel_value}.tif')
    view_sel.rio.to_raster(output_file)
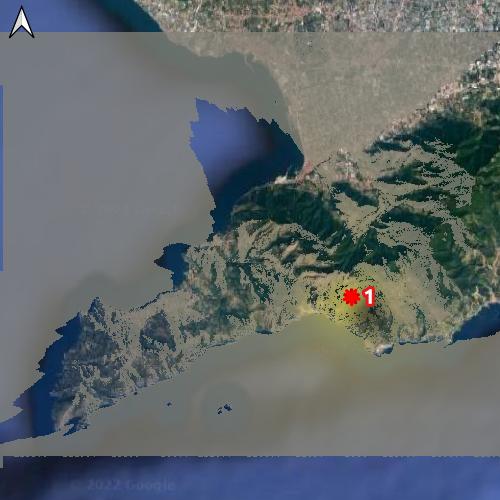
Point 1 - quota 875 metri

Point 2 - quota 413 metri

Point 3 - quota 106 metri

Point 4 - quota 0 metri

Point 5 - quota 0 metri

Point 6 - quota 475 metri

Point 7 - quota 0 metri

Point 8 - quota 1225 metri

Point 9 - quota 0 metri

Point 10 - quota 0 metri

Point 11 - quota 450 metri

Conclusione

L'analisi di visibilità è fortemente infuenzata dalla risoluzione del DEM, più è spinta maggiore sarà la qualità dell'output. Di contro più è spinta la risoluzione del DEM maggiore sarà il tempo necessario per il processamento di ogni singolo punto di osservazione. Nel mio caso ci ho impiegato in media 4 secondi a punto.